Docket #: S10-010
SPADE – Data Analysis and Visualization Software for FACS and other Multidimensional Data
Stanford researchers have developed a versatile computational approach for easily visualizing and analyzing multidimensional molecular data, such as flow cytometry data. This software, called SPADE (spanning-tree progression analysis of density-normalized events), graphically connects clusters of multidimensional data in a progressive structure. It is complementary to existing approaches for analyzing cytometry data by enabling analysis of differentiation and branching even if the user has no prior knowledge of the underlying cell population. For FACS data, the algorithm can perform gating analysis, discover lineages of cellular progression and differentiation, and identify uncharacterized cellular features that are relevant to progression of cells. The invention can also be generalized for applications to other multidimensional datasets, including microarray data and in-vivo medical images.
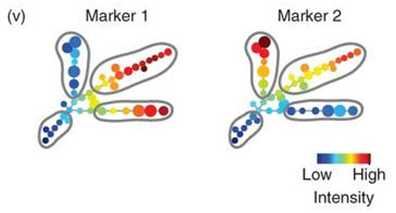
Final SPADE output of a colored tree showing cellular heterogeneity. This tree was produced from a simulated two-parameter flow cytometry data set, with one rare population and three abundant populations. The nodes are colored by the median intensities of protein markers of cells in each node, allowing visualization of the behaviors of the two markers across the entire heterogeneous cell population.
Stage of Research
The software is implemented in MATLAB and the inventors have demonstrated the utility of SPADE with cytometry data from mouse and human bone marrow. In both cases, SPADE organized cells in a hierarchy of related phenotypes. They have also used SPADE to analyze results from simultaneous monitoring of 18 molecular markers to provide system-wide views of immune signaling in human hematopoiesis.
Applications
- Flow cytometry/FACS (flourscence activated cell sorting) analysis such as:
- gating - selection of subpopulations of cells for further analysis of their molecular properties
- discovering a progressive relationship underlying the cellular subpopulations – to define lineages and hierarchy of cellular progression and differentiation
- identifying molecular markers that drive this underlying progression
- Data visualization for other multidimensional datasets, such as:
- microarray data on bulk tissue specimens
- in-vivo medical images
Advantages
- Scalable for multiple markers and high-dimensional molecular data
- Automated analysis - does not rely on expert knowledge of underlying cellular phenotypes
- Identifies rare cell types
- Easily visualized branching tree output that recapitulates branched cellular hierarchy of cell differentiation/progression which is often missed by current FACS analysis software
Publications
- Peng Qiu, Erin F. Simonds, Sean C. Bendall, Kenneth D. Gibbs Jr., Robert V. Bruggner, Michael D. Linderman, Karen Sachs, Garry P. Nolan and Sylvia K. Plevritis, "Extracting a Cellular Hierarchy from High-dimensional Cytometry Data with SPADE", Nature Biotechnology, vol. 29, no. 10, pp. 886-891, published online October 2, 2011.
- Sean C. Bendall, Erin F. Simonds, Peng Qiu, El-ad D. Amir, Peter O. Krutzik, Rachel Finck, Robert V. Bruggner, Rachel Melamed, Angelica Trejo, Olga I. Ornatsky, Robert S. Balderas, Sylvia K. Plevritis, Karen Sachs, Dana Pe'er, Scott D. Tanner, and Garry P. Nolan. "Single-Cell Mass Cytometry of Differential Immune and Drug Responses Across a Human Hematopoietic Continuum", Science, May 6, 2011.
Related Links
Patents
- Published Application: 20130060775
- Issued: 10,289,802 (USA)
Similar Technologies
-
Therapeutic to restore vision loss S18-081Therapeutic to restore vision loss
-
Low-cost, portable, and high-resolution pediatric volumetric ultrasound scanner for real-time imaging with anesthesia or radiation S21-150Low-cost, portable, and high-resolution pediatric volumetric ultrasound scanner for real-time imaging with anesthesia or radiation
-
Imaging software for task-evoked conditions S18-083Imaging software for task-evoked conditions